
IT admins want a short list of numbers that shows whether their service desk is getting better and where it is slipping. Most guides on IT service management (ITSM) metrics hand them 25+ metrics instead, with few formulas and no advice on where to start.
This guide covers the 14 core ITSM metrics, grouped by the question each one answers. You get a simple formula for each metric, a starter set for small teams, and the trade-offs to watch so your numbers don’t push the team in the wrong direction.
What are ITSM metrics?
ITSM metrics are numbers that show how well an IT team delivers and supports its services. They cover work like fixing incidents, fulfilling service requests, rolling out changes, and keeping systems running for employees.
Most of these numbers come straight from your ticketing data. Every ticket records when it was created, who picked it up, when someone replied, and when it was resolved. Good ITSM metrics turn that record into answers about speed, quality, workload, and reliability.
Why do so many IT teams struggle with ITSM metrics?
Most small and mid-sized IT teams are still fixing the basics, so measurement often comes later. In Desk365’s State of IT Helpdesks survey of helpdesk users at small and mid-sized businesses, reports and analytics ranked fifth among the capabilities teams want to get stronger at. One of three respondents wanted to get better at reporting and analytics.
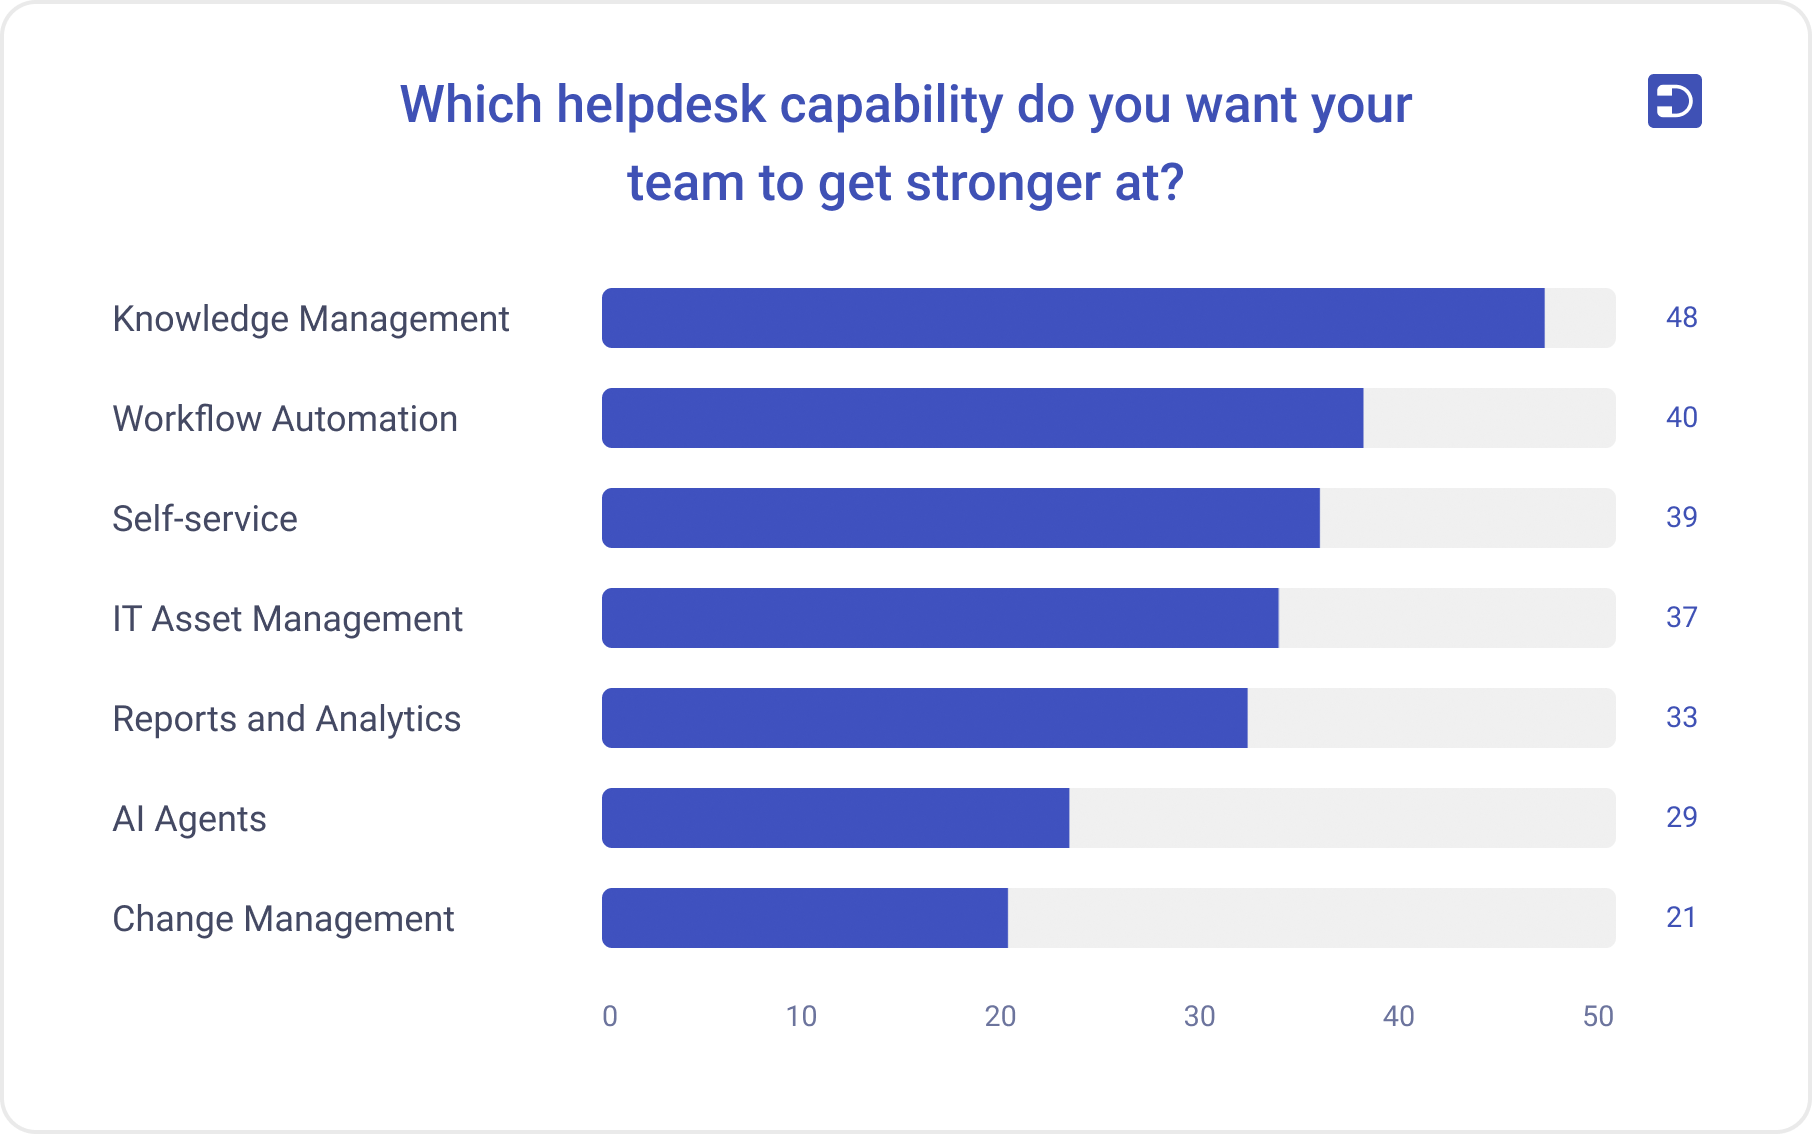
Knowledge management, workflow automation, self-service, and IT asset management all ranked above reporting. It’s still a top 5 priority, but not the most important. The same survey found that 64 of 92 respondents say missing information slows their workflows, and a team still chasing ticket details won’t get much from a dashboard yet.
IT leaders raise the same gap in public forums. One r/CIO thread asks whether anyone is actually getting useful analytics out of their tools. A long-running r/sysadmin thread asks IT managers which metrics and KPIs they use to measure their teams. When a report doesn’t help, the usual cause is that nobody decided what question it should answer.
Should you set goals before choosing ITSM metrics?
Yes. Decide what outcome you want first, then pick the two or three metrics that show whether you are getting there. A metric with no goal behind it becomes a number people glance at and forget.
The goal can be simple. “Employees should wait less for help” or “we keep fixing the same printer issue” is enough to point you to the right numbers.
| Goal | Metrics that show progress |
|---|---|
| Employees wait less for help | First response time, mean time to acknowledge |
| Fewer repeat problems | Reopen rate, recurring incidents |
| Keep promises to the business | SLA compliance |
| Keep systems up after updates | Service availability, change success rate |
| Show IT’s value to leadership | Cost per ticket, customer satisfaction |
This is the step most dashboards skip. Desk365’s view is that a short list of metrics tied to one clear goal will do more for an IT team than a dashboard of 25 numbers nobody acts on.
What are the core ITSM metrics every IT team should track?
The 14 core ITSM metrics fall into six groups: speed, quality, workload, SLA commitments, reliability, and cost. Each group answers one question about your service desk, and together they give a balanced picture that no single number can.
Speed metrics: how fast does IT respond?
1. First response time (FRT)
First response time is how long a person waits between submitting a ticket and getting the first reply from a human agent. Leave automatic acknowledgment emails out of this number.
Formula: total time to first reply across all tickets ÷ number of tickets

A fast first reply calms people down. It only counts as good service when that reply moves the ticket forward.
2. Mean time to acknowledge (MTTA)
Mean time to acknowledge is the average time between a ticket arriving and someone taking ownership of it. It measures how quickly tickets get assigned, not how quickly they get fixed.
Formula: total time from creation to assignment ÷ number of tickets

A long MTTA usually points to routing. Tickets sit in a shared queue because no rule sends them to the right person or group.
3. Mean time to resolve (MTTR)
Mean time to resolve is the average time from ticket creation to resolution. Some teams use MTTR to mean mean time to repair or recover, so write down which definition you use.
Formula: total resolution time across resolved tickets ÷ number of resolved tickets

Track MTTR by priority. One average across every ticket hides the slow high-priority incidents that hurt the business most.
Quality metrics: did IT fix the problem well?
4. First contact resolution (FCR)
First contact resolution is the share of tickets resolved in the first interaction, with no escalation or follow-up. A closely related number is escalation rate, the share of tickets passed from first-line support (L1) to specialists at L2 or L3.
Formula: tickets resolved on first contact ÷ total tickets × 100

A rising FCR is one of the clearest signs that your knowledge base and agent training are working.
5. Reopen rate
Reopen rate is the share of resolved tickets that get reopened for the same issue. It is the quality check on every speed metric above.
Formula: reopened tickets ÷ resolved tickets × 100

If MTTR drops while reopen rate climbs, your team is closing tickets faster than it is fixing problems.
6. Customer satisfaction (CSAT)
Customer satisfaction is the share of employees who rate their support experience as positive, usually in a short survey sent after a ticket is resolved. Some teams also run Net Promoter Score (NPS) surveys to measure overall loyalty to IT support.
Formula: positive survey responses ÷ total survey responses × 100

A small number of responses can swing CSAT a lot. Check how many people answered before you react to the score.
Workload metrics: how much work is coming in?
7. Ticket volume
Ticket volume is the number of tickets created in a set period. Split it by category, channel, priority, and group to make it useful.
Formula: count of tickets created in the period

Volume on its own says little. Volume by category tells you what to automate, document, or fix at the root next.
8. Backlog
Backlog is the number of open tickets that are not yet resolved. The simplest way to watch it is to compare tickets created with tickets resolved over the same period.
Formula: open tickets at the start of the period + tickets created − tickets resolved

If tickets created beat tickets resolved for several weeks in a row, the backlog will keep growing until something changes.
9. Average time in status
Average time in status shows how long tickets sit in each stage, such as Open, In Progress, Waiting on Customer, or Waiting on Vendor.
Formula: total time tickets spent in a status ÷ number of tickets that entered that status

This is the metric that shows where work stalls. A ticket that spends three days in Waiting on Vendor needs a different fix than one stuck in Open.
SLA metrics: is IT keeping its promises?
10. SLA compliance
SLA compliance is the share of tickets that met their response or resolution targets. A service level agreement sets those targets, usually by priority.
Formula: tickets that met the SLA ÷ total tickets with that SLA × 100

Track response SLAs and resolution SLAs as two separate numbers. A team can reply quickly and still miss most of its resolution targets.
Reliability metrics: do IT services stay up?
11. Service availability
Service availability, often called uptime, is the share of time a service works as agreed. For example, 99.9% availability allows about 8.8 hours of downtime in a year.
Formula: (total time − downtime) ÷ total time × 100

Employees notice an outage far more than a slow ticket, so this number shapes how people judge IT.
12. Recurring incidents
Recurring incidents counts how often the same issue comes back in a set period. It points to problems whose root cause nobody has fixed.
Formula: count of incidents that share a root cause or category in the period

This is where problem management starts. Fixing the root cause of one recurring issue removes every future ticket it would have created.
13. Change success rate
Change success rate is the share of changes, such as updates, patches, and configuration changes, that go live without causing an incident or a rollback.
Formula: successful changes ÷ total changes × 100

Change management ranked last among the capabilities in Desk365’s survey, with 21 votes. Many small IT teams can start tracking this once they log every change in one place.
Cost metrics: what does support cost?
14. Cost per ticket
Cost per ticket is the average cost of handling one ticket. Include agent salaries, software, and overhead for the period.
Formula: total support cost for the period ÷ tickets resolved in the period

Use this number to show trends and value to leadership, not to rank agents. A cheap ticket that comes back twice costs more than a careful one that stays closed.
ITSM metrics cheat sheet
This table lists every core ITSM metric, the question it answers, and the metric to read beside it so one number doesn’t mislead you.
| Metric | Question it answers | Read it alongside |
|---|---|---|
| First response time | How long do people wait for a first reply? | Reopen rate |
| Mean time to acknowledge | How fast do tickets get an owner? | Ticket volume |
| Mean time to resolve | How long does a fix take? | Reopen rate |
| First contact resolution | How often is the first contact enough? | CSAT |
| Reopen rate | Did the fix hold? | Mean time to resolve |
| CSAT | Are employees happy with support? | Number of survey responses |
| Ticket volume | How much work is coming in? | Volume by category |
| Backlog | Is open work piling up? | Tickets created vs. resolved |
| Average time in status | Where do tickets stall? | Mean time to resolve |
| SLA compliance | Are we meeting our targets? | CSAT |
| Service availability | Do services stay up? | Recurring incidents |
| Recurring incidents | Which issues keep coming back? | Ticket volume by category |
| Change success rate | Do changes break things? | Service availability |
| Cost per ticket | What does each ticket cost? | Reopen rate |
Which ITSM metrics should a small IT team track first?
A small IT team should start with six metrics: first response time, mean time to resolve, SLA compliance, backlog, reopen rate, and CSAT. Together they cover speed, quality, workload, and how employees feel about support.
These six come straight from ticket data, so you can track them from day one without extra tools or process changes. Each one also has a partner in the set. Reopen rate keeps MTTR honest, and CSAT shows whether meeting SLA targets is making people happier.
Add the other metrics once these six are steady and someone reviews them every week. Reliability metrics like change success rate need change records, and cost per ticket needs budget data, so they fit better once the basics run smoothly.
A team of three or four people doesn’t need 14 numbers on a screen. It needs six that someone looks at every Monday.
Which ITSM metrics can mislead you?
Any ITSM metric can mislead you when you read it alone or turn it into a target for individual agents. The fix is to pair each number with one that checks it.
Speed metrics are the easiest to game. When MTTR becomes a target, agents feel pressure to close tickets early, and the same issues come back as reopened tickets. Watch MTTR and reopen rate together.
SLA compliance can look healthy while employees are unhappy. Pausing the SLA clock in statuses like Waiting on Customer is fair, but heavy use of those statuses hides real delays. Desk365’s guide to CSAT vs. SLA covers why the two numbers often disagree.
Averages hide outliers. A two-hour average resolution time can include a handful of high-priority incidents that took two days. Split speed metrics by priority, and look at the slowest tickets as well as the average.
Falling ticket volume isn’t always good news. It can mean self-service is working, or it can mean people stopped asking IT for help and found their own workarounds. Check CSAT and recurring incidents before you celebrate.
Agent leaderboards cause the most damage. Ranking agents by tickets closed rewards quick, easy tickets and punishes the people who take on hard ones. Use metrics to find process problems, and talk to agents about the rest.
How often should IT teams review ITSM metrics?
Review ITSM metrics on three schedules: daily for work at risk, weekly for team performance, and monthly or quarterly for trends you report to leadership.
| How often | Metrics to review | Why |
|---|---|---|
| Daily | Backlog, tickets close to breaching SLA | Catch problems before they become late tickets |
| Weekly | First response time, MTTR, reopen rate, ticket volume by category | Spot slowdowns and repeat issues while they are fresh |
| Monthly or quarterly | CSAT trend, SLA compliance, availability, change success rate, cost per ticket | Show progress against goals and plan staffing or tools |
The schedule matters more than the tool. A weekly 15-minute review of six metrics will change more than a detailed dashboard that nobody opens.
How do you track ITSM metrics in Desk365?
Desk365 is a helpdesk and IT service management tool built for Microsoft Teams. It provides ready-made reports for most of the core ITSM metrics in this guide, along with dashboards and scheduled exports for sharing them.
The Ticket Trends report breaks volume down by agent, type, priority, status, channel, category, group, and custom fields. That breakdown is what turns a raw ticket count into a list of issues worth automating or documenting.
The Productivity reports show averages in minutes, hours, or days and can use business hours. Business hours keep a ticket logged at 5pm on Friday from looking like a weekend-long delay.
The Home tab works as a daily dashboard. It shows ticket status cards, tickets by agent, priority, category, and status, and panels for average times and surveys. Plus and Premium plans let admins create several dashboards for different groups.
Scheduled ticket exports give you the raw data for metrics like first contact resolution, reopen rate, and cost per ticket.
You can see every report in one place on the Desk365 helpdesk reporting and analytics page. Start a free trial to see it in action.