


The core objective of a helpdesk is to provide quick and effective customer support. To achieve this, streamlined processes, strong customer support systems, and detailed documentation are essential to empower your service team.
Chaotic systems, complex request procedures, and disorganized teams can turn minor issues into significant challenges for both customers and team members seeking help.
Whether aiding customers or employees, your helpdesk should focus on simplicity, efficiency, and precision.
By utilizing customer support metrics and service desk KPIs, you can uncover strengths in your support services and pinpoint areas that require enhancement.
Additionally, measuring helpdesk metrics can provide deeper insights into the effectiveness of your help desk, helping you make data-driven decisions to improve service quality.
What are helpdesk metrics?
Helpdesk metrics are like the scorecard for customer support teams. They help businesses understand how well their support efforts are working and where they can make improvements.
These metrics are crucial for evaluating the performance of your helpdesk software, it should include things like how many tickets are being handled, how quickly issues are resolved, the number of interactions per agent, response times, resolution rates, customer satisfaction levels, and more.
By keeping an eye on these metrics, companies can see how efficient their support team is, how happy customers are with the service they receive, and where they might need to tweak things to provide even better support.
Why is it essential to measure helpdesk metrics?
Data plays a pivotal role in ensuring long-term success for businesses, and this holds for service desks as well. By tracking Key Performance Indicators (KPIs) and metrics, your organization can:
- Enhance decision-making within the service desk.
- Lower support costs by identifying areas for optimization and efficiency.
- Develop improved support documentation and workflows, leading to more streamlined operations.
- Decrease support resolution times, resulting in quicker issue resolution for customers.
- Enhance overall customer experience and satisfaction by addressing pain points effectively.
- Empower employees with better IT support, enabling them to work more efficiently and effectively.
What are the important helpdesk metrics you should track?
While each organization may require specific metrics tailored to their services, here are 12 commonly used helpdesk metrics that every enterprise should consider tracking to initiate benchmarking and enhance their helpdesk experience.
1. First Response Time (FRT)
2. Resolution time
3. Ticket volume
4. Customer Satisfaction Score (CSAT)
5. Net promoter score (NPS)
6. First Contact Resolution Rate (FCR)
7. Ticket Backlog
8. Customer Effort Score (CES)
9. Average Handle Time (AHT)
10. Escalation Rate
11. Service Level Agreement Compliance
12. Time to Resolution (TTR)
1. First Response Time (FRT)
The first response time is one of the important helpdesk metrics that refers to the duration it takes for a company or support team to initially reply to a customer’s inquiry or request.
Formula for calculating first response time (FRT)
FRT is calculated by subtracting the time of customer request from the time of the first response.

Why is it important to calculate the first response time?
Calculating first response time (FRT) is important in customer service as it directly impacts customer satisfaction, loyalty, and brand trust.
Responding quickly to customer inquiries helps build trust and positive relationships with customers, leading to increased satisfaction and potentially higher retention rates.
Research shows that customers expect quick responses when contacting a company, with 83% expecting immediate interaction.
Read More – 8 ways to improve customer response time
2. Resolution time
Resolution time is the duration when a customer initiates a request for support until the support team fully resolves the issue.
Formula for calculating resolution time
Resolution time is calculated by subtracting the total number of resolved tickets from the total resolution time.

Why is it important to calculate resolution time?
Calculating resolution time is essential for businesses to evaluate the efficiency of their support teams and ensure timely resolution of customer issues.
By monitoring resolution times, businesses can assess their performance, identify areas for improvement, and optimize workflows to enhance customer service.
Additionally, tracking resolution times helps businesses comply with service level agreements (SLAs) and maintain high levels of customer satisfaction by addressing issues promptly.
3. Ticket volume
Ticket volume refers to the total number of customer requests or inquiries received by a customer support team within a specific period.
Both your IT service management (ITSM) team and your customer service team need to keep track of the number of incoming service requests, also known as support tickets.
This metric provides insights into customer demands, support agent workload, and resource allocation.
Why is it important to calculate ticket volume?
Tracking ticket volume is crucial for businesses as it provides valuable insights into customer demand, resource management, and operational efficiency.
By monitoring the number of customer inquiries or requests received within a specific period, organizations can better understand the workload on their support teams, anticipate trends, and allocate resources effectively to ensure timely responses to customer queries.
Tracking ticket volume is crucial for adjusting workflows, and staffing levels, anticipating trends, and managing ticket surges effectively to enhance customer satisfaction and reduce employee burnout.
Analyzing ticket volume helps identify potential bottlenecks in the support process, enabling businesses to streamline operations and improve overall efficiency.
4. Customer Satisfaction Score (CSAT)
Customer Satisfaction Score (CSAT) is an essential helpdesk metric to determine if customers are happy with a product or service. It’s usually measured by asking customers to rate their satisfaction on a scale, from 1 to 5.
Businesses that track CSAT scores see a 33% higher retention rate. The CSAT score shows how satisfied customers are overall. It helps businesses see if they’re doing a good job meeting customer needs and if there are areas, they can improve to make customers happier.
Formula for calculating CSAT

Measuring your company’s CSAT is straightforward. Your CSAT survey will feature questions with various response options, as shown in the example below:
“How would you rate your overall satisfaction with the help you’ve received?”
- Extremely satisfied
- Mostly satisfied
- Neither satisfied nor dissatisfied
- Mostly dissatisfied
- Extremely dissatisfied
To determine your CSAT score, begin by counting the number of positive responses you received. Positive responses include those rated as either 1 (“Extremely Satisfied”) or 2 (“Mostly Satisfied”). Then, divide the total number of positive responses by the total number of responses received.
To calculate the CSAT (Customer Satisfaction Score) divide the number of positive responses received by the total number of responses collected and then multiplying the result by 100
Let’s say you conducted a CSAT survey and received responses from 50 customers. Out of these responses, 35 customers rated their satisfaction as either “Extremely Satisfied” or “Mostly Satisfied” (considered positive responses).
Using the formula:
CSAT = (Number of Positive Responses / Total Number of Responses) * 100
CSAT = (35 / 50) * 100
CSAT = (0.7) * 100
CSAT = 70%
So, in this example, your CSAT score would be 70%.
Why is CSAT important?
One of the key reasons why CSAT is crucial lies in its ability to provide a clear picture of customer satisfaction, helping businesses see their products or services from the customers’ perspective
This insight enables companies to improve the customer experience by addressing pain points and enhancing their offerings based on direct feedback
Moreover, CSAT surveys help in identifying areas for improvement, uncovering new ideas from customers, and ultimately driving higher revenue through improved customer loyalty and retention rates.
Read more – 100 Customer survey questions to ask in 2025
5. Net promoter score (NPS)
The Net Promoter Score (NPS) is a metric used to measure customer loyalty and satisfaction based on a simple question: “How likely are you to recommend our product/service to a friend or colleague?”
Customers typically respond on a scale from 1 to 10, with those giving a score of 9 or 10 considered promoters, 7 or 8 as passive, and 1 to 6 as detractors.
The NPS is calculated by subtracting the percentage of detractors from the percentage of promoters.
Formula for calculating NPS

NPS is calculated by subtracting the percentage of detractors by the percentage of promoters.
NPS = Percentage of Promoters – Percentage of Detractors
Let’s say you conducted a survey and received responses from 100 customers. Out of these responses, 60 customers rated their likelihood to recommend your product/service as 9 or 10 (Promoters), 20 customers rated it as 7 or 8 (Passives), and 20 customers rated it as 0 to 6 (Detractors).
To calculate NPS:
- Calculate the percentage of Promoters: (60/100) * 100 = 60%
- Calculate the percentage of Detractors: (20/100) * 100 = 20%
- Subtract the percentage of Detractors from the percentage of Promoters: NPS = 60% – 20% = 40%
So, in this example, your Net Promoter Score (NPS) would be 40%.
Why is it important to measure NPS?
Net Promoter Score (NPS) is a valuable metric for businesses for several reasons. Firstly, it allows companies to distinguish between customers who are promoters, passives, and detractors.
Promoters are loyal advocates, passives are indifferent, and detractors are unhappy customers. This segmentation enables businesses to focus on retaining promoters and addressing issues with detractors to enhance overall customer satisfaction.
6. First Contact Resolution Rate (FCR)
First Contact Resolution Rate (FCR) is a metric that measures the percentage of customer support issues that are resolved on the first contact.
It is an important metric for businesses to track because it provides insights into how effectively their customer support team is handling inquiries.
A high FCR rate indicates a well-trained and effective customer support team, while a low rate suggests room for improvement.
Formula for calculating the first contact resolution rate
FCR is calculated by dividing the total number of customer support requests by the issues resolved on the first contact.

Why is it important to measure first contact resolution rate?
Measuring first contact resolution (FCR) is crucial for several reasons.
Firstly, it directly impacts customer satisfaction. Resolving an issue on the first contact eliminates the need for customers to follow up multiple times, leading to faster resolution and higher satisfaction levels.
Secondly, FCR is closely linked to operational efficiency. Resolving issues quickly reduces the workload on support agents and minimizes the need for escalations, allowing the support team to handle a higher volume of inquiries effectively.
7. Ticket Backlog
Ticket backlog refers to the accumulation of unresolved support tickets or customer inquiries that the support team has not yet addressed. It represents the number of pending tickets that require attention and resolution.
A high ticket backlog can indicate inefficiencies in the support process, such as resource constraints, high ticket volumes, or longer response times.
Why is it important to measure ticket backlog?
Tracking ticket backlog is crucial for several reasons. Firstly, it enables the identification of areas where customer support is lagging, ensuring timely assistance for customers.
Secondly, it serves as a gauge for customer satisfaction; a growing backlog may signal dissatisfaction with the support provided. Lastly, monitoring the backlog helps in spotting trends and patterns in customer support requests.
This understanding empowers startups to adapt processes and procedures to better fulfill customer needs.
8. Customer Effort Score (CES)
Customer Effort Score (CES) is a metric derived from a customer satisfaction survey that measures the ease of using a product or service, finding necessary information, or resolving issues
Customers are asked to rate the effort they had to exert, typically on a scale like “very easy” to “very difficult,” to interact with a company.
A high CES score indicates an effortless experience for customers, while a low score suggests that processes may be challenging, or customer support may be ineffective.
Formula for calculating Customer Effort Score (CES)

Customer Effort Score (CES) is calculated by dividing the sum of responses for effort questions by the total number of survey responses.
In practical terms, CES is often measured on a scale, such as 1 to 5 or 1 to 7, where respondents rate their agreement with statements related to the effort required to complete a task or resolve an issue.
The average score across all responses is then calculated to determine the overall Customer Effort Score.
Why is it important to track CES?
Tracking Customer Effort Score (CES) is essential for businesses as it provides valuable insights into the level of effort customers exert during interactions with a company.
By monitoring CES, organizations can identify areas where customers may encounter challenges or high levels of effort, enabling them to streamline processes, enhance usability, and improve the overall customer experience.
Additionally, CES serves as a predictive metric for customer loyalty, allowing businesses to anticipate future customer behaviour, mitigate churn risks, and implement strategies to retain customers
9. Average Handle Time (AHT)
Average Handle Time (AHT) is a crucial metric used in customer service to measure the average duration of a customer interaction, typically a phone call, chat, or email.
AHT encompasses various components such as total talk time, hold time, and follow-up time, providing insights into the efficiency of agents in resolving customer needs
A good average handle time is generally around six minutes, but this can vary based on industry standards, the complexity of interactions, and the type of support provided
Formula for calculating average Handle time (AHT)

The Average Handling Time (AHT) is calculated by adding the total talk time, total hold time, and total after-call work time, and then dividing the sum by the total number of interactions.
In this formula:
- Total Talk Time refers to the amount of time an agent spends actively communicating with a customer during a call.
- Total Hold Time is the duration customers are placed on hold during interactions.
- Total After-Call Work Time represents the time agents spend completing tasks related to the interaction after the call ends.
- Total Number of Interactions is the total number of customer interactions handled by the agents during the specified period.
Why is it important to measure average handle time (AHT)?
Measuring Average Handle Time (AHT) is vital for call centers to track how long agents spend on customer calls.
It helps identify efficient agents, evaluate performance, and improve processes. While aiming for shorter call times is good, balancing speed with quality is key for a positive customer experience.
Setting appropriate AHT targets and analyzing it alongside other metrics like Customer Satisfaction Score (CSAT) can highlight areas needing improvement and enhance overall service quality.
In essence, monitoring AHT enables call centers to streamline operations, optimize customer interactions, and boost satisfaction levels.
10. Escalation Rate
Ticket escalation rate refers to the frequency at which support tickets are escalated to higher levels of support or management within an organization.
When a support ticket cannot be resolved by frontline support agents or within a specified timeframe, it may be escalated to more experienced agents, supervisors, or specialized teams for further assistance or resolution
Formula for calculating ticket escalation rate
The Escalation Rate, expressed as a percentage, is calculated by dividing the number of escalated tickets by the total number of tickets received, and then multiplying the result by 100.

Why is it important to measure ticket escalation rate?
Measuring ticket escalation rate is a critical aspect of customer support operations.
This metric serves as a key indicator of the effectiveness of the initial support tier in resolving customer issues.
By tracking how many tickets are escalated to higher levels due to complexity or unresolved issues, companies can assess the performance of their frontline support staff.
A high escalation rate can highlight underlying problems such as product issues, inadequate training, or unclear escalation procedures. Addressing these issues can lead to improved customer satisfaction by ensuring timely and efficient problem resolution.
11. Service Level Agreement (SLA) Compliance
Service Level Agreement (SLA) Compliance refers to the degree to which a service provider fulfills the terms and conditions specified in the SLA established with the customer.
SLAs serve as contractual documents outlining the expected level of service from the provider, encompassing factors such as response times, resolution times, uptime, and availability.
For instance, if an SLA dictates that the service provider must address support inquiries within 24 hours, SLA compliance evaluates how frequently the provider meets or surpasses this response time criterion.
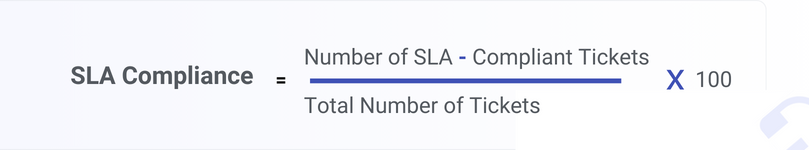
Formula for calculating service level agreement (SLA) compliance
SLA Compliance percentage is determined by dividing the number of instances compliant with the SLA by the total number of instances and then multiplying the result by 100.
Why is it important to measure service level agreement (SLA) compliance ?
Measuring Service Level Agreement (SLA) compliance is crucial for businesses to uphold their commitments to customers and maintain operational efficiency.
By monitoring SLA compliance, organizations can assess their performance against agreed-upon service levels, ensuring that services are delivered as promised.
This process allows companies to identify areas of improvement, address potential bottlenecks, and enhance overall service quality. Moreover, tracking SLA compliance enables businesses to proactively manage customer expectations, build trust, and strengthen client relationships
12. Time to Resolution (TTR)
Time to Resolution (TTR) refers to the duration it takes for a service provider to fully resolve a customer’s issue or request, starting from the moment the issue is reported or the request is made until it is satisfactorily resolved.
Formula for calculating time to resolution
The formula to calculate Time to Resolution (TTR) is obtained by dividing the total resolution time by the number of resolved issues.

Why is it important to measure time to resolution?
Measuring Time to Resolution (TTR) is essential for understanding your customer support effectiveness and making improvements.
It directly impacts customer satisfaction, as faster resolutions lead to happier customers.
Additionally, it provides valuable insights into your team’s efficiency, highlighting potential bottlenecks such as resource limitations or inefficient workflows.
Track, Analyze, and Improve your Helpdesk Performance with Desk365
Best practices for improving your helpdesk metrics
Improving your help and service desk metrics is crucial for delivering exceptional customer support and enhancing your team’s efficiency. Here are some best practices to consider:
1. Define clear metrics
Start by clearly defining the metrics that are most important for your service desk. Common metrics include First Response Time, Average Resolution Time, Customer Satisfaction (CSAT), Net Promoter Score (NPS), and Ticket Volume.
2. Set realistic goals
Once you’ve identified your key metrics, set realistic and achievable goals for each. Make sure these goals are aligned with your overall business objectives and customer service standards.
3. Implement automation
Automate routine tasks and workflows to reduce manual effort and improve customer response times. Use automation tools to categorize, prioritize, and assign tickets to the right agents.
4. Provide adequate training
Ensure that your service desk team is well-trained and equipped with the necessary knowledge and skills to handle customer inquiries efficiently. Regular training sessions and access to a knowledge base can help improve resolution times and customer satisfaction.
5. Use a ticketing system
Implement a robust ticketing system like Desk365, that allows you to track, manage, and analyze customer interactions. This can help you identify trends, monitor performance, and make data-driven decisions to improve your service desk metrics.
6. Monitor and analyze performance
Regularly monitor your service desk’s performance against the set goals. Use analytics and reporting tools to identify areas for improvement and track the impact of changes made.
7. Encourage customer feedback
Encourage customers to provide feedback on their support experience. Use this feedback to identify areas for improvement and make adjustments to your service delivery.
8. Prioritize customer experience
Always prioritize the customer experience. Ensure that your service desk is focused on resolving issues effectively and providing a positive experience for your customers.
Track the helpdesk metrics that matter
Monitoring help desk metrics is crucial for evaluating your progress, assessing employee and team performance, and gauging customer satisfaction. Desk365’s helpdesk software comes equipped with robust reporting features that provide all the essential data you need.
However, it’s important to note that tracking every single metric might lead to confusion rather than clarity. Therefore, selecting the right help desk metrics that align with your business objectives is essential.
Desk365 offers exceptional reporting capabilities that allow you to track key metrics from start to finish. With these tools, you can oversee agent performance.
Schedule a demo with Desk365 today and discover how it can enhance your overall customer service experience.
Frequently asked questions
A KPI (Key Performance Indicator) for a service desk measures critical aspects of its performance. Common KPIs include:
- First Response Time (FRT) – The time it takes for an agent to respond to a customer’s issue.
- Ticket Resolution Time – The average time it takes to resolve a ticket.
- Customer Satisfaction (CSAT) – A score reflecting how satisfied customers are with the service.
- First Contact Resolution (FCR) – The percentage of issues resolved in the first interaction.
- Ticket Volume – The number of tickets created over a period.